The Cerbos PDP dashboard is now on the Grafana Cloud dashboards site. Import it by ID, point it at your Prometheus data source, and every instance in your fleet is on one screen, from health and loaded policy count down to latency percentiles.
It runs on the Prometheus metrics the PDP has exposed since the first release, so there is nothing new to configure on the PDP side.
What the dashboard shows about your PDP fleet
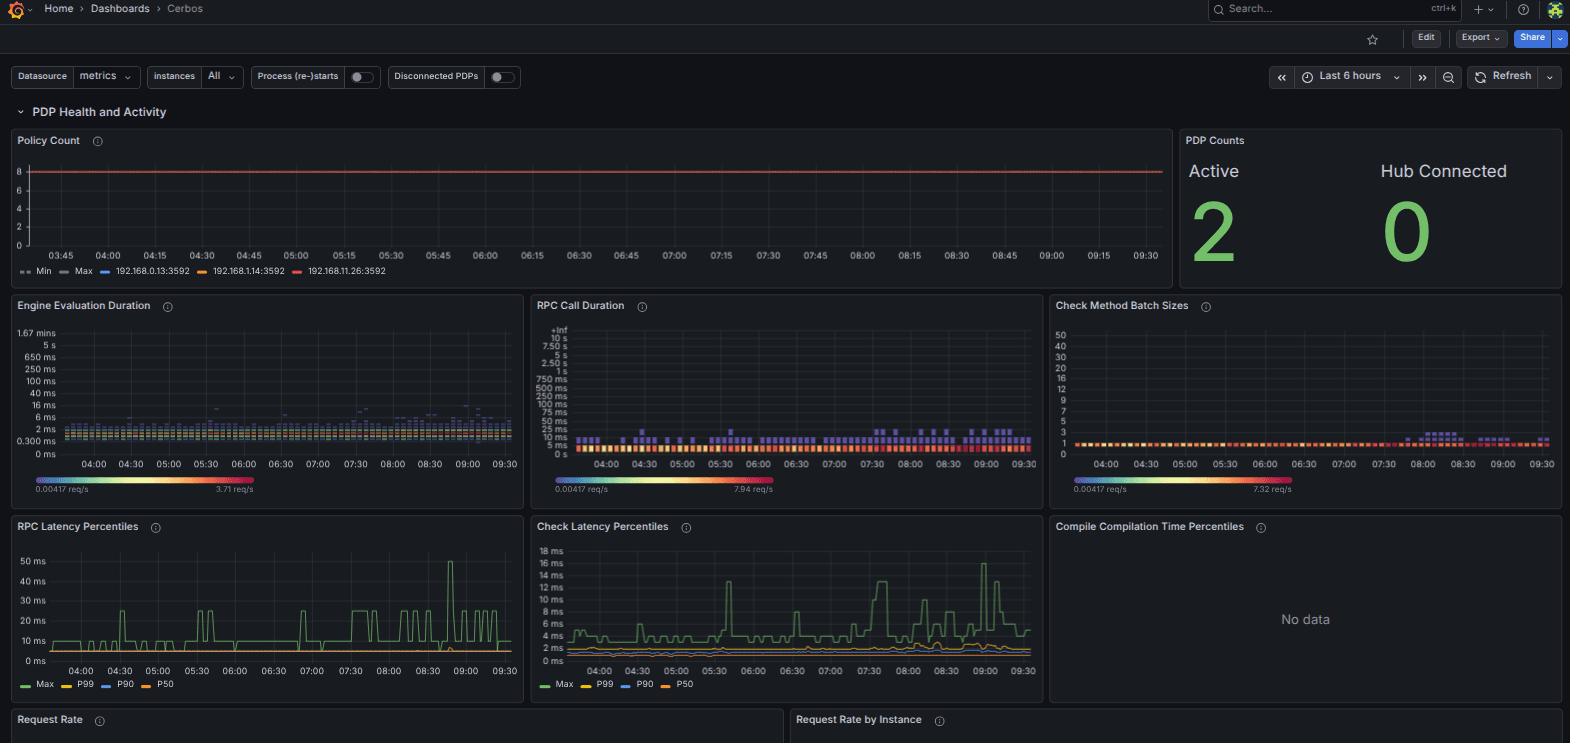
The top row is health. Each PDP reports whether it is up and whether it is connected to Cerbos Hub. A PDP that loses its Hub connection keeps serving decisions from the last bundle it received, so nothing fails immediately, but it also stops picking up policy changes. This panel is how you find out before someone reports that a permission change has not taken effect.
Next to it is the loaded policy count for each instance. In a healthy fleet every PDP shows the same number. A mismatch usually means an instance is still on an older bundle or a rollout has not reached it yet, and it is much easier to spot as a number on a panel than by comparing logs across pods.
The traffic panels cover request, response and error rates with histograms and percentiles, so you can see whether a latency spike is across the board or confined to one instance or one call type. Below that sit CPU and memory usage, including the internal caches, and the subset of Go runtime metrics that are actually useful when a process is under pressure.
Instance restarts and Hub disconnections are overlaid as annotations on every time series, so when you look at a spike the event that caused it is drawn on the same graph. That removes the usual step of cross-referencing timestamps against deployment history.
Importing the dashboard
In Grafana, go to Dashboards, choose New and then Import, and enter the ID 25769. Pick your Prometheus data source and you are done. If your scrape config already labels PDPs with instance and job=cerbos, every panel populates on first load. If you use different labels, the dashboard JSON is on the same page and the label names are easy to change.
For the metrics themselves, Cerbos PDP serves them at /_cerbos/metrics in Prometheus format and can also push them over OTLP. Both options are covered in the observability docs.
Metrics tell you the PDP is healthy, audit logs tell you what it decided
The dashboard answers operational questions. Is the fleet up, is it keeping up with traffic, is it on the current policy. It does not tell you why a particular request was allowed or denied.
That is what audit logs in Cerbos Hub are for, and the two work together. A restart annotation on the dashboard tells you when a PDP came back, and the audit log tells you what it decided in the minutes around it. Together they cover the full picture of observability for the authorization layer, from process health down to individual decisions.
If you have built your own panels on the Cerbos metrics over the years, we would love to see them. The published dashboard is a starting point and revisions are welcome.
Try Cerbos Hub to connect your PDPs and see the health and policy panels light up, or book a call to walk through your deployment with our team.
FAQ
Tagged in